Trending with Grafana
Description
To enable you to monitor metrics for your services, we provide a managed Grafana instance.
This gives you access to Prometheus metrics stored in a central Cortex cluster.
Metrics are collected for the following services:
- Basic metrics for virtual instances
- Apache
- NGINX
- MySQL
- PostgreSQL
- Elasticsearch
- Redis
- Memcached
- K8s cluster metrics (for MetaKube Operator customers)
Access
To access your Grafana instance, you need access to our SSO (powered by Keycloak). If you do not yet have access, please open a ticket via our support or send an email to support@syseleven.de.
Creating Users
Once the Keycloak realm has been provisioned, you can create users with a temporary password.
- Log in to the Keycloak console at
https://login.syseleven.de/auth/admin/PROJECT-NAME/console/. - Click on
Usersin the left-hand menu. - Click
Add Useron the right-hand side to open theAdd Userpage. - Enter at least a username.
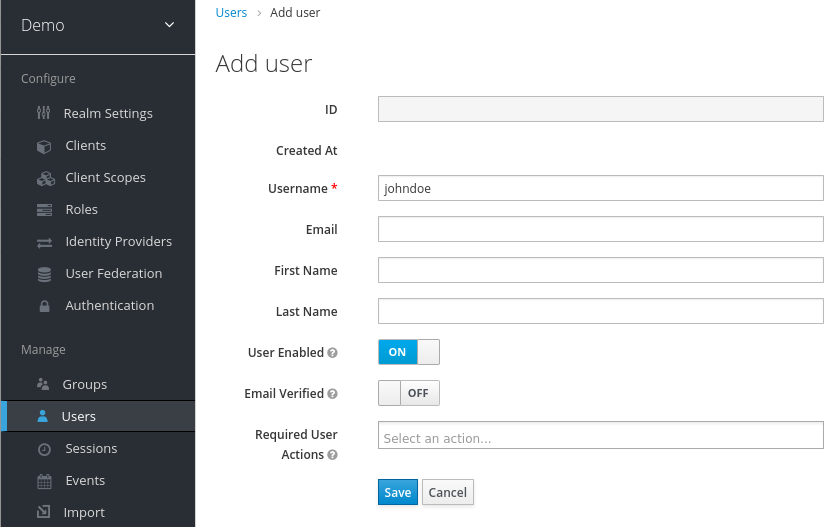
- Set the
Email Verifiedswitch toON. - Switch to the
Credentialstab at the top. - Enter a temporary password and click
Set password.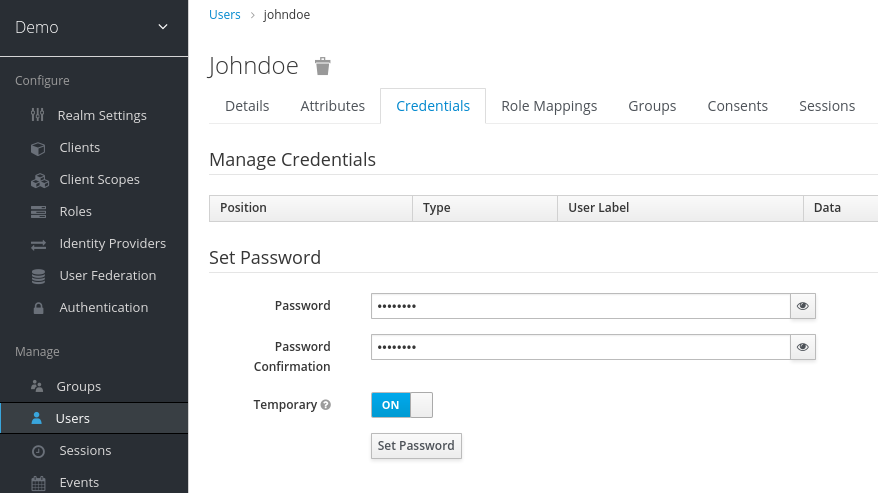
Upon the first login, the created user will be prompted to change their password. You can find further information on our SSO in our MetaKube documentation and in the upstream documentation.
Once the Keycloak realm has been created, a Grafana instance is automatically provisioned and becomes available within one hour.
By default, all Keycloak users in your realm have access to the managed Grafana instance and can create and import dashboards. Dashboards provisioned by us are read-only.
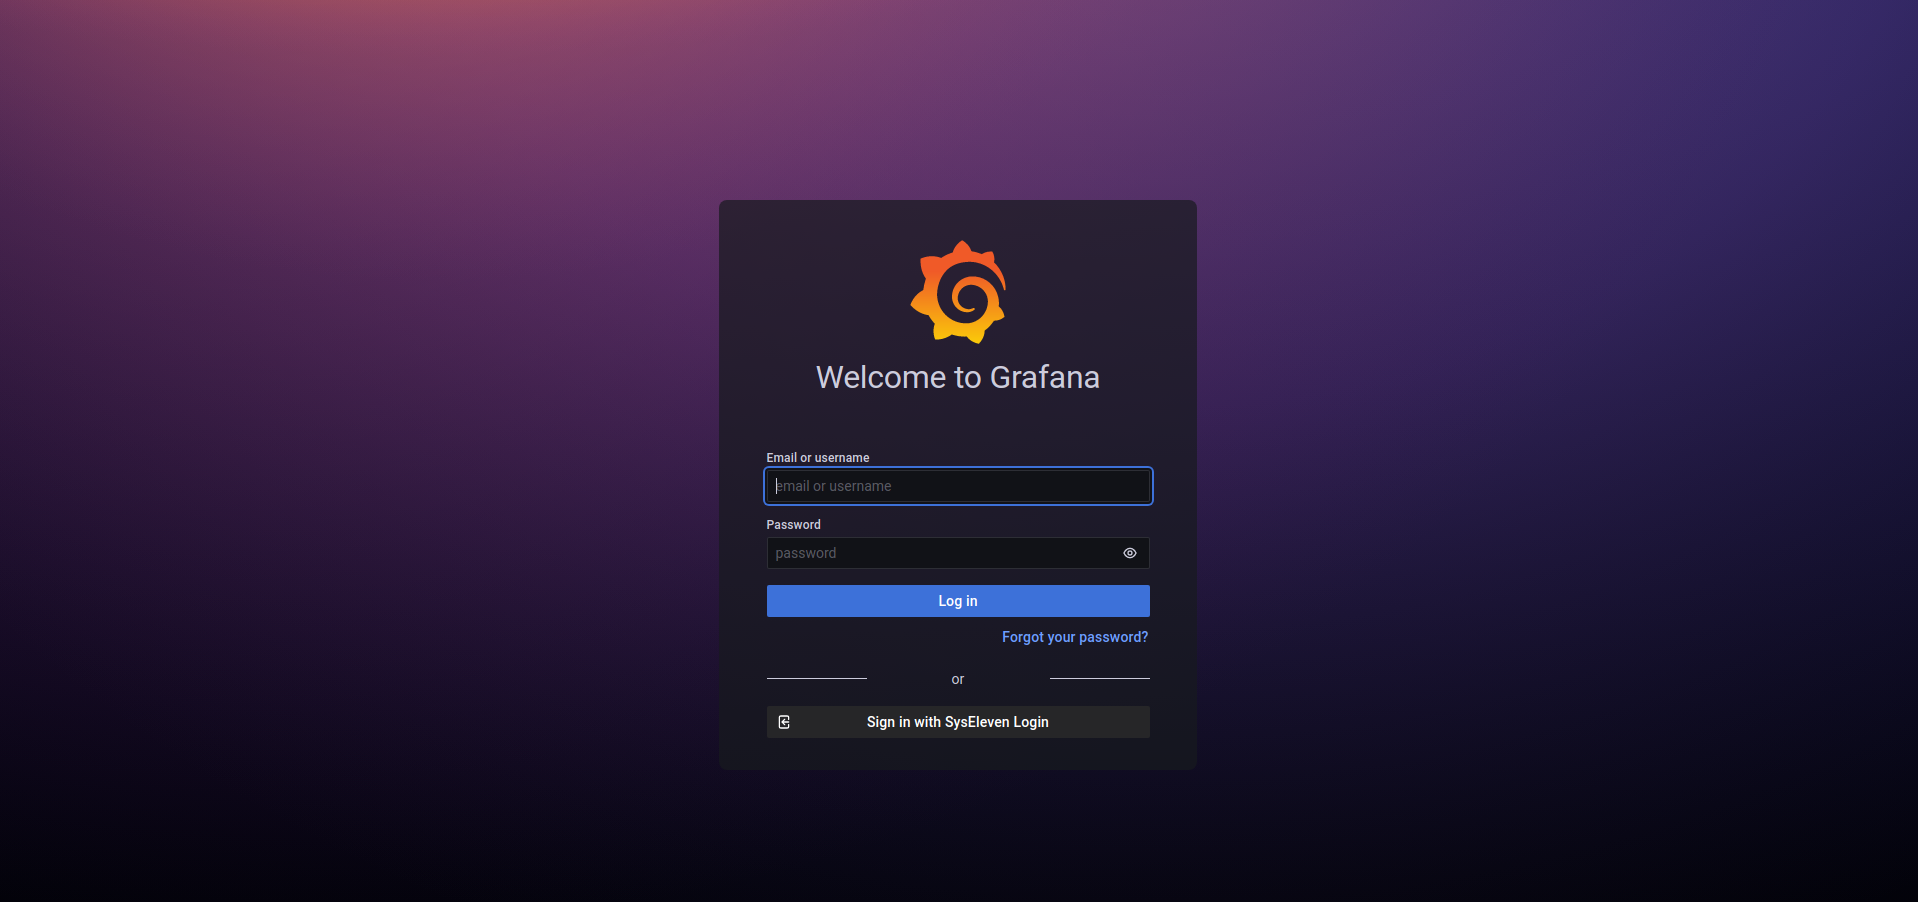
After the Keycloak realm is created, the Grafana instance is accessible at https://PROJECT-NAME.grafana.syseleven.de, and you can log in using the Sign in with SysEleven login button.
Dashboards
We provide a curated list of dashboards for a range of services. You can find these in your Grafana instance via the left-hand menu under Dashboards → Manage or at https://PROJECT-NAME.grafana.syseleven.de/dashboards.
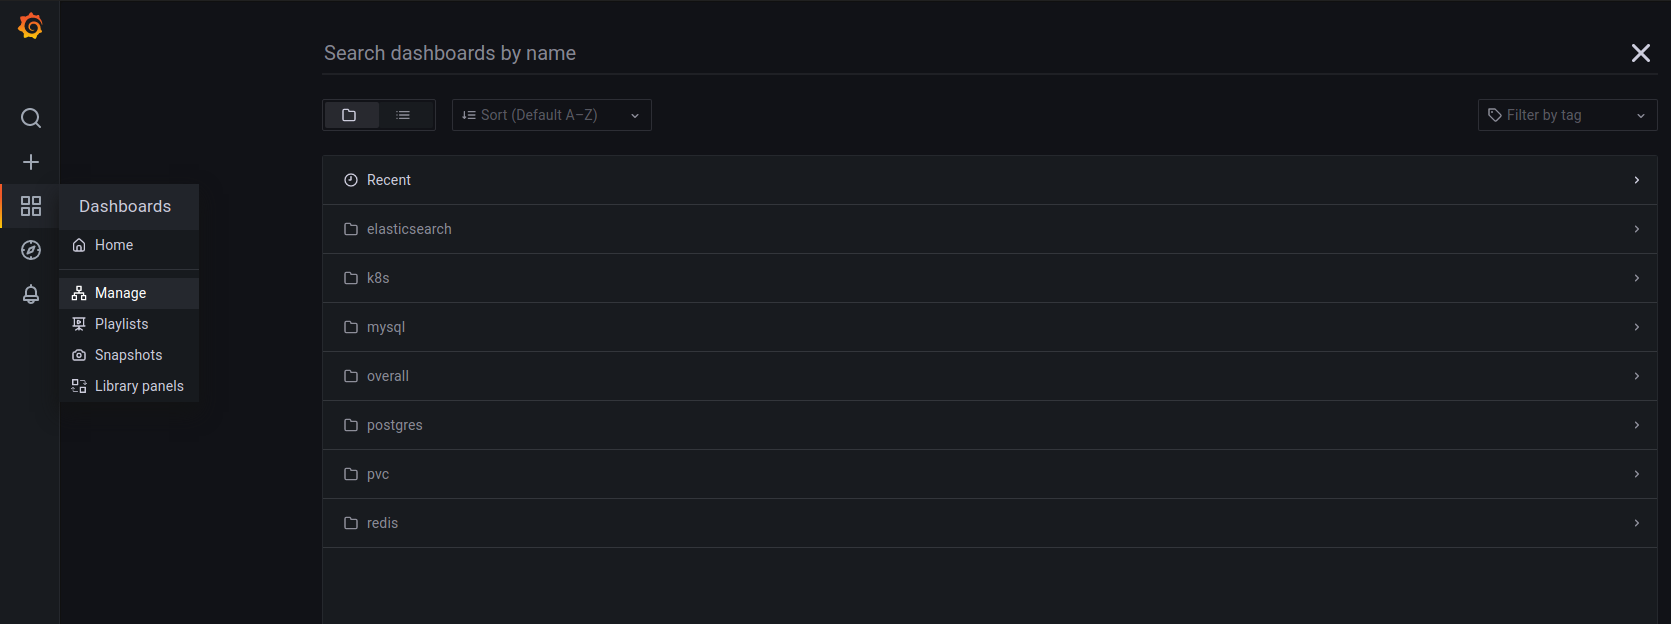
In addition the dashboards we provision, you can also create or import your own dashboards within your Grafana instance. These are stored persistently and backed up once every 24 hours. For more information, please refer to the Grafana documentation.
Retention Period
Metrics are retained for 14 months. After this time, they are deleted.
Metrics from Multiple Projects in a Single Grafana Instance
If you require access to metrics from multiple projects within your Grafana instance, please feel free to contact us.